Exploratory data analysis and data quality
Concept
Before we address the research question, we examine the data itself. This step is easy to skip, and it is especially easy to skip when working with an assistant that will produce a finished-looking analysis from the raw files without pausing to object. When we skip it, flaws in the data pass straight through into the conclusions, and no error message tells us it has happened.
Exploratory data analysis (EDA), in the sense used here, is about asking questions before
we analyze the data for our experimental question. EDA asks whether the data
mean what we think they mean. EDA looks for the places where the data depart from what a
data analyst would reasonably assume. And we then decide what to do about each deviation.
When you ask an AI system to run the analysis for you, some version of this process happens
inside the system. The important takeaway is to understand the process and the
assumptions, because those are what get automated away, out of sight. And those "out of
sight" assumptions may not be the same ones you would make if you were doing the analysis
yourself.
Every check in this lesson follows the same four steps. The loop is the skill worth having memorized:
- State the assumption you are about to rely on.
- Ask Claude to test it using the data.
- Read the result, and ask whether it is plausible.
- Confirm it a second way before believing it, then decide what to do.
The fourth step is often the one people skip. But it is the one that matters most. A wrong number arrives in the same fluent, confident format as a right one. We don't accept a result because it looks reasonable. We check it again by a different route.
A note on the data
The dataset you will work with in this lesson is simulated. We ran the real task on a
few pilot participants, and their data is kept separately in data/pilot/, but three
people are far too few to demonstrate a group-level analysis. So we generated a cohort
of 40 participants (data/synthetic/) whose behavior was built to match the real task:
the same three phases, the same timing, the same rules for when a click earns a point.
We did this on purpose, for two reasons. First, a cohort of 40 lets us show both kinds of analysis that this workshop cares about. It shows you how to conduct the single-subject analysis common in behavior analysis. And it allows you to conduct the group-level analysis that other fields expect. Second, we seeded the simulated data with the kinds of quality problems that real online data often contains, so that we have something to practice catching. Everything here is simulated unless we say otherwise, and we will keep saying so.
One more point of orientation. In responses.csv, a single row is a single click, not
a single participant. Forty people produced roughly twelve thousand rows. Any summary
that treats those rows as if they were independent people will mislead you. Keep that
distinction in view throughout.
We will work four questions in depth. Each one groups together several specific issues and teaches one reusable check. A few smaller items are named at the end for self-study.
Question 1 — Do the tables join cleanly?
The assumption: every response belongs to a participant we know about, and every participant has exactly one demographics record.
Ask Claude:
Load participants.csv, demographics.csv, and responses.csv from data/synthetic/.
Report: (a) how many rows in responses.csv have a participantId that does not
appear in participants.csv, (b) how many participants have no demographics row,
(c) how many participants have more than one demographics row, and (d) how many
participants have zero responses. Show the code.
What comes back:
resp = pd.read_csv("data/synthetic/responses.csv")
part = pd.read_csv("data/synthetic/participants.csv")
demo = pd.read_csv("data/synthetic/demographics.csv")

orphans = resp.loc[~resp["participantId"].isin(part["id"])]
print(len(orphans))                                         # 18
print(len(set(part["id"]) - set(demo["participantId"])))    # 1  no demographics
print((demo["participantId"].value_counts() > 1).sum())     # 1  filled it twice
print(len(set(part["id"]) - set(resp["participantId"])))    # 1  never responded
What the code is doing: each response has a participantId that is meant to match a person
in the participant table. The first check looks for responses whose participantId matches
nobody, and finds 18. The next three ask whether any participant is missing their
demographics form (1 is), filled it out twice (1 did), or produced no task data at all (1
did not).
Confirm it a second way. The direction of a "is this value in that list?" test is easy to get backwards, and a count that is wrong for that reason looks exactly like a count that is right. So we ask for the same four numbers again, arrived at differently.
Ask Claude:
Work out all four of those numbers again, using a different method than you used
the first time. Start over from the files rather than reusing your earlier code or
your earlier answers. Then show me both sets of numbers side by side and tell me
whether they agree. If any of them disagree, stop and tell me which ones. Show the
code.
Notice what this prompt does not do. It does not mention the number being checked. Had we asked Claude to confirm that there are 18 orphan rows, we would almost certainly have been told yes, because agreeing with a number already on the table is easier than counting it again. Ask for a fresh count and a comparison instead, and you get a real check.
Claude works all four out again. Its second count of the orphan rows arrives by a different route than the first one did:
matched = resp.merge(part, left_on="participantId", right_on="id", how="inner")
print(len(resp) - len(matched))    # 18  -> agrees with the first method
Rather than looking for responses that match nobody, this keeps only the responses that do match a participant and counts how many were left behind. Both routes give 18. If they had disagreed, that disagreement, not either number, would be the thing to investigate. And, Claude can identify the root cause if you ask it to.
What you decide: An orphan response can't be attributed to a person, so it has to be dropped from the analysis. But you should document that you dropped 18 rows and why. The duplicate demographics form needs a rule, such as keep the first submission. The participant with no responses is not a stray row to delete. Rather, it is a person who reached the task and did nothing, which is what the next question is about.
Question 2 — Who counts as valid data?
The assumption: everyone in the file engaged with the task in good faith and without any technical disruptions or malfunctions. On a remote, paid platform such as Prolific, this assumption might be false. Deciding whose data to include is your judgment to make and to justify, not the AI system's to make for you.
Ask Claude:
Using only responses whose participantId is in participants.csv, compute the number
of responses per participant and describe the distribution. Separately, flag any
participant whose median inter-response time is under 150 ms, computed from
respondedAt. Then report, from participants.csv, how many have taskCompleted = f,
how many have consented = f, and the distribution of comprehensionAttempts.
What comes back:
responses per participant:  min 23   median 248   max 2662
median inter-response time under 150 ms:  1 participant  (n = 2662, median 0.097 s)
taskCompleted = f:           4 participants
consented = f:               1 participant   (but has task responses)
comprehensionAttempts:       {1: 29, 2: 10, 5: 1}
Reading the output: "responses per participant" counts how many clicks each person produced.
The typical participant made 248, but the range runs from 23 to 2,662. The "inter-response
time" is the gap between one click and the next; a person can't click much faster than about
150 milliseconds, so a participant whose typical gap is 97 milliseconds is not a person
clicking, and their 2,662 clicks will distort any average they are included in. At the other
extreme, one participant made only 23 clicks, most of them on the distractor. Four
participants never reached the end of the task (taskCompleted = f). One has task data even
though consented = f, which means the consent step did not exclude everyone it should
have. One needed five attempts to pass the comprehension check.
Confirm it by looking rather than summarizing. A single average would have hidden all of this; the extremes are visible only if you inspect the ends of the distribution:
rpp = resp[resp["participantId"].isin(part["id"])].groupby("participantId").size()
print(rpp.sort_values().head(3).to_list())   # [23, ...]     the disengaged end
print(rpp.sort_values().tail(3).to_list())   # [..., 2662]   the automated end
This sorts participants by how many clicks they made and prints the three lowest and three highest. A histogram makes the same point visually.
What you decide: set your inclusion rules before you look at the results that depend on them, and write them down. Exclude the automated responder; decide whether five comprehension attempts disqualifies a participant; decide whether non-completers contribute partial data or none. The failure to consent is a separate issue and more about how the experiment was programmed.
Question 3 — Can you trust the values?
The assumption: each column contains the kind of value you expect.
Ask Claude:
For responses.csv, show the data type and the unique values of the reinforced column.
For demographics.csv, show the counts of each distinct gender string and the minimum
and maximum age.
What comes back:
reinforced:  type = text,  values = ['f', 't']
gender:      {'Female': 13, 'Male': 9, 'Man': 5, 'Prefer not to say': 4,
              'non-binary': 2, 'Non-binary': 2, 'Woman': 2, 'F': 1,
              'female': 1, 'male': 1}
age:         min 18,  max 142
Three problems here, and none of them produced an error on its own. First, reinforced
looks like a true/false column, but it is stored as the text "t" and "f", which is how
the database writes true/false values into a spreadsheet. If you treat it as genuine
true/false, the operation may fail outright or return the wrong answer. Second,
gender came back in ten different spellings of perhaps four intended answers. Third, an age
of 142 is not a real person. Prolific screens for ages 18 and over, so values below 18
should be watched for as well.
This is not a hypothetical hazard. While preparing this lesson, an early output version
from Claude treated reinforced as true/false and stopped with the error
bad operand type for unary ~: 'str'. The data was fine. The assumption that the column
was true/false was not, and that distinction is what this lesson is about.
Confirm it, and fix it, by telling Claude what must be true rather than hoping it is. The rules below are yours to set because they are research decisions rather than technical ones. But they are examples you could run with. Turning those rules into working code is Claude's part.
Ask Claude:
Fix these three problems. After each fix, add a check that stops the analysis with
an error if the fix did not work, instead of letting it carry on.

- Convert reinforced from the text "t" and "f" into real true/false values, then
  check that the column really is true/false now.
- Standardize gender into "Male", "Female", "Non-binary", and "Prefer not to say". Keep
  "Prefer not to say" as its own category and do not merge it into anything else.
  List every original spelling you put into each category so I can check your
  choices.
- Every age should be between 18 and 100. Check that this holds, and tell me which
  records fail. Do not fix or remove them; I will decide what to do about those.

Show the code.
What comes back:
resp["reinforced"] = resp["reinforced"].map({"t": True, "f": False})
assert resp["reinforced"].dtype == bool       # stop now if it is not truly true/false

gender_map = {"male": "Male", "M": "Male", "Man": "Male",
              "female": "Female", "F": "Female", "Woman": "Female",
              "non-binary": "Non-binary"}
demo["gender"] = demo["gender"].replace(gender_map)

assert demo["age"].between(18, 100).all()      # this line fails, surfacing the 142
The assert lines are the checks we asked for, and they are the point. An assertion
states a condition that must hold and stops the analysis if it does not. Here the first
converts the text into real true/false values and checks that it worked; the last states
that every age falls between 18 and 100, and it fails, which is how we want the 142 to
become apparent rather than slip through.
Two things in the prompt are likely worth using in your own work. First, we asked to be told which records fail rather than have them repaired because deciding what to do about an age of 142 is a researchers' judgment call. Second, we asked for the list of spellings that went into each gender category because that is a mapping we have to be able to defend in a write-up. Both are cases of keeping the decision with us while handing over the labor to Claude.
Question 4 — Does time make sense?
The assumption: the timestamps are well-formed, in order, and consistent with the task's five-minute condition lengths of two minutes (Ph. 1), two minutes (Ph. 2), and one minute (Ph. 3).
Ask Claude:
Parse respondedAt in responses.csv into datetimes. For each participant, compute the
total task duration as last minus first response. Report the median and any values
over 600 seconds. Also flag any response whose respondedAt is earlier than that
participant's createdAt in participants.csv.
The first attempt fails, and the failure is useful:
ValueError: time data "2026-07-06 17:05:14" doesn't match format
"%Y-%m-%d %H:%M:%S.%f"
Ask Claude:
That failed with a date-format error. Before you change anything, tell me whether
this is a problem with the data or a problem with your code, and what in the file
caused it. Then fix it, rerun, and tell me how many rows had the unexpected format
so I know how widespread it was.
Asking which of the two it is, before accepting any fix, is the habit worth building here. An AI assistant told only to "fix it" will make the error go away, and you won't learn whether it went away because the code got better or because the data was trimmed to make it go away. Those two outcomes can look identical: the error is gone and the analysis runs.
This time the code was wrong and the data is fine. Most timestamps record a fraction of a second, but about one in eight do not, because a moment that falls exactly on a whole second is written without a fractional part. A parser that learns one exact format from the first row then breaks on the first row that differs.
Once it parses:
task duration:  median 295 s   (about 5 minutes, as designed)
over 600 s:     1 participant at 1457 s (about 24 minutes)
respondedAt earlier than createdAt:  1 response, 1 participant
Reading the output: for each participant we measured the time from their first click to their last. The typical participant took 295 seconds, almost exactly the five minutes the task is designed to run, which is reassuring. But one participant's clicks span 24 minutes. Maybe they left the tab open partway through?
Ask Claude:
Take the participant with the longest span. List the gaps between their clicks from
largest to smallest, and plot their clicks over time so I can see where any gaps
fall. Tell me which phase they were in on either side of the biggest gap. Then, if
I set aside that one gap, what is their remaining span, and how does it compare to
the median participant?
What comes back:
clicks:                      153
largest gap:                 1177 s  (about 20 minutes)
next largest gap:              15 s
biggest gap falls between:   last phase 1 click and first phase 2 click
span minus the largest gap:   279 s  (median participant: 295 s)
The plot also shows a dense band of clicks, one long blank stretch, then a dense band again. Each vertical line is one click, and a typical participant is drawn above for comparison.
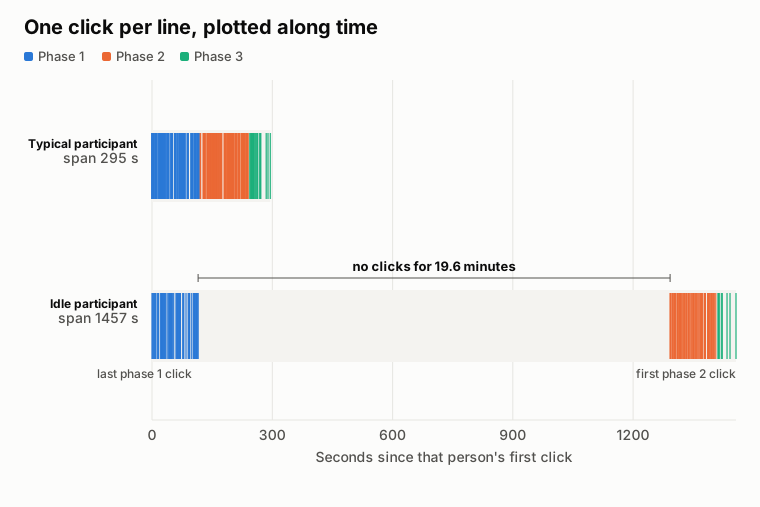
The hole also sits exactly at the phase 1 to phase 2 transition, which is where a person would be likely to step away. Had the 24 minutes instead been built from many medium gaps spread throughout, we would be looking at a different problem needing a different remedy.
The tactic we just walked through generalizes. When you see something that doesn't quite look right, that's the moment to ask Claude to figure out what is going on, and how that answer will influence what you do with those data or that participant.
Highlighted, not worked
There are at least two further checks you would want to go through. They are left for self-study and are described in the data-quality spec.
- Timestamp precision, as a general habit. We met it above when the parse failed. The general rule: never split a timestamp by hand at the dot; use a parser that tolerates mixed precision.
- Education is an ordered category, not an unordered one. "Some college" falls between "High school diploma" and "Bachelor's degree." Define that order before you plot or model it, or every summary will sort the levels alphabetically and imply an order that is wrong.
Key points
- You should always check for data quality issues before you conduct analytics around the research question. These issues will not appear in the output unless you ask for them.
- Use one loop everywhere: state the assumption, test it, read the result, and confirm it a second way before believing it.
- A single average does not show the cases that matter. Look at the whole distribution and its extremes.
- Convert types and state what must be true with assertions; standardize categories; range-check numbers. The problems that do not produce an error are the dangerous ones.
- Whom to include and whom to exclude is your decision to make in advance and to justify, not the AI system's to make for you.
Exercise
Choose one of the four questions and run it yourself on data/synthetic/. For a
single participant it flags, decide whether to keep or exclude them, and write one or two
sentences justifying the decision the way you would in a methods section. Then confirm
your flag a second way, using a different computation that should reach the same
conclusion, and check that the two agree.
Checklist
Use this before you trust any analysis of a new dataset. Read it yourself to make sure nothing was skipped, and paste it to Claude to have it work through each item against your data. A ready prompt for the second use is at the bottom.
Joins and completeness
- Every response traces to a known participant; count and document any orphan rows you drop.
- Every participant has exactly one demographics record, with none missing and none duplicated.
- Any participant with zero responses is noted rather than passed over.
Who counts as valid data
- The distribution of responses per participant is examined, not just the average, including both extremes.
- Impossibly fast responders are flagged (median inter-response time under about 150 ms).
-
taskCompleted,consented, andcomprehensionAttemptsare checked, and inclusion rules are written down before results are examined.
Values you can trust
- Each column contains the type you expect; text true/false (
"t"/"f") is converted to real true/false. - Categories are standardized to your intended set (for example, the spellings of gender).
- Numbers are range-checked (for example, age within 18-100), using assertions that fail loudly.
Time
- Timestamps are parsed with a parser that tolerates mixed precision.
- Each participant's responses run forward in time and fall after their
createdAt. - Time on task is reconstructed from the phase structure, not from the raw first-to-last span.
The behavioral pattern to follow
- For every check: state the assumption, test it, read the result, and confirm it a second way before believing it.
- Every exclusion and every transformation is documented, along with the reason.
To use this with Claude, paste the checklist and add:
Work through each item on this checklist against the CSV files in data/synthetic/.
For each item, show the check you ran, the result, and whether it passed. Where an item
fails, explain what you found and propose a fix, but do not change any data until I
confirm. Remember that a single row is one click, not one participant.