Primary analysis: response rates across phases
Concept
Now we can answer the question the study was designed to ask. The task changed which circle
earned points from phase to phase: the R1 circle contacted reinforcement in phase 1,
the R2 circle contacted reinforcement in phase 2, and nothing contacted reinforcement
in phase 3. If earning points controls behavior, then clicking should concentrate on
whichever circle currently contacted reinforcement, and should reduce in phase 3 when
nothing contacted reinforcement. The primary analysis asks whether that is what happened.
Two ideas influence how we conduct the primary analysis. First, we compare rates, not raw counts. Phase 3 lasts one minute while phases 1 and 2 last two minutes each, so phase 3 is likely to show fewer clicks. Dividing each count by the length of its phase turns it into clicks per minute and makes the phases comparable. Second, we can conduct the analysis at the group level, averaging across participants, and at the individual level. The group view is what many fields report. The individual level is central to behavior analysis, where each participant is expected to show the effect.
First, apply the decisions from data quality
The earlier lesson found rows that should not enter this analysis. We act on those decisions before computing anything.
Ask Claude:
Load responses.csv from data/synthetic/. Convert the reinforced column from "t"/"f" to
true/false. Drop responses whose participantId is not in participants.csv. Exclude the one
automated responder identified earlier (median inter-response time under 150 ms). Report
how many participants and how many response rows remain.
What comes back:
remaining: 38 participants, 9,119 response rowsReading the output: we removed the orphan rows that belonged to no participant and the single automated responder whose clicking was not human. We are left with 38 participants. Doing this first, and stating that we did it, means the analysis that follows is based on the data we chose deliberately rather than on whatever happened to be in the file.
Counts become rates
Ask Claude:
For the cleaned data, count each participant's clicks on each button within each phase.
Convert each count to a rate in clicks per minute, using phase lengths of 2 minutes for
phase 1, 2 minutes for Phase 2, and 1 minute for Phase 3. Then report the group mean
rate for each button in each phase.
What comes back:
group mean response rate (clicks per minute)

phase 1            phase 2         phase 3
R1    43.6         R1    6.4       R1    5.7
R2    6.6          R2   43.9       R2    5.2
distractor   5.3   distractor 5.4  distractor 8.7
Reading the output: in phase 1, the R1 circle was clicked about 44 times a minute,
while the other two circles sat near 5 or 6. In phase 2, R2 was clicked about 44 times a
minute and R1 fell to about 6. The distractor, which never paid, stays near 5 in both phases.
In short, clicking followed the points. This is good and suggests our contingency
controlled behavior as expected. In phase 3, when nothing led to points, clicks to R1
and R2 fell to about 5 a minute, while the distractor increased to 8.7.
Confirm it a second way. A rate is only a rescaled count, so multiplying a rate back by its phase length has to return the original count. And a mean is only trustworthy as a summary if it sits near the middle of the people it summarizes.
Ask Claude:
Before I trust that table, check it two ways. First, undo the conversion by multiplying
each rate back by the length of its phase and confirm you get the original click
count. Tell me if any cell does not come back exactly, and show me one worked
example so I can follow the arithmetic. Second, report the median next to the mean
for every cell, so I can see whether each mean is describing a typical participant
or being pulled by a few extreme ones.
What comes back:
round-trip check: all 331 cells return their original count exactly
worked example:   one participant, R1 in phase 1, 89 clicks over 2 minutes
                  89 / 2 = 44.5 clicks per minute, and 44.5 x 2 = 89

                          mean   median
phase 1   R1              43.6     45.5
          R2               6.6      6.5
          distractor       5.3      5.0
phase 2   R1               6.4      6.5
          R2              43.9     47.0
          distractor       5.4      5.0
phase 3   R1               5.7      6.0
          R2               5.2      6.0
          distractor       8.7      9.0
Conducting this reverse check doesn't tell us whether rate is the right thing to compute. But it does tell us that the numbers are are seeing involve the count we started with and that it was divided by what we thought it should be divided by. That is a nice check because a phase length applied to the wrong phase would produce a wrong table that looks right.
The mean and median columns are another interesting check. They track each other closely
in every cell, which suggests these group averages describe the response distributions well rather
than being influenced by outliers. Where they differ, as in phase 2 R2 with a mean of 43.9
against a median of 47.0, the mean is the lower of the two. This is a classic the signature of a
few low responders pulling down the mean.
The same result, one participant at a time
In behavior analysis we expect each participant to show the effect individually, so we look.
Ask Claude:
For one completing participant, plot responses per minute across the session, with a
separate data path for R1, R2, and the distractor. Follow the conventions used in
behavior-analytic journals: minutes on the horizontal axis, responses per minute on
the vertical, a solid vertical line at each phase change, no data path drawn across a
phase change, and a different marker shape for each button. Label the conditions
above the plot.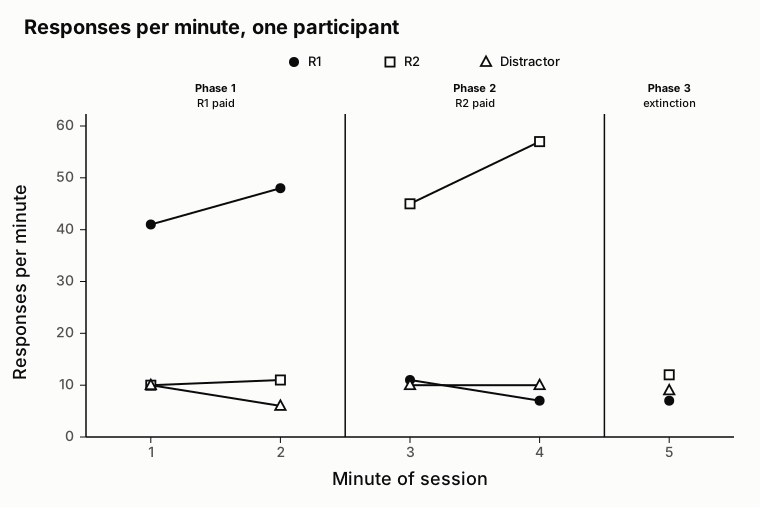
Reading the graph: this participant emitted a response pattern similar to the group pattern.
Rate of repsonding on R1 in phase 1 was 41 and 48 responses per minute. In phase 2,
responding to R1 decreased to the level of the distractor, and responding to R2
increased to 45 and 57 responses per minute. In phase 3, responding to all three buttons
decreased.
Resurgence
Resurgence is the return of a previously reinforced response when an alternatively reinforced
response stops contacting reinforcement or its reinforcement schedule degrades. Here, R1 was
reinforced in phase 1, R2 was reinforced in phase 2, and no reinforcement was programmed in
phase 3. If resurgence occurred, R1 clicking should increase when phase 3 begins.
A resurgence analysis, thus, involves comparing the R1 rate immediately before and immediately
after the phase 3 boundary. The distractor belongs in the same comparison. It never
contacted reinforcement in any phase, so whatever happens to it cannot be resurgence and
increases on the distractor would indicate extinciton-induced variability as a candidate
controlling behavioral process.
Ask Claude:
Compare the last 30 seconds of phase 2 with the first 30 seconds of phase 3 for each
of the three buttons separately, in responses per minute. Include the distractor,
which was never reinforced, so I can see whether any increase is specific to R1. Then
report how many participants individually show a higher R1 rate after the boundary
than before it. Use only participants who reached phase 3.
What comes back:
                 last 30 s of     first 30 s of
                 phase 2          phase 3          ratio
R1                     7.1              9.0         1.27
R2                    44.3              8.9         0.20
distractor             6.2             13.5         2.17

participants with a higher R1 rate after the boundary:  26 of 35
Reading the output: On average, R1 increases from from 7.1 to 9.0 responses per
minute when R2 stops contacting reinforcement. And, 26 of the 35 participants
who reached phase 3 show that increase individually. That is what resurgence looks like.
We can also plot these data to see the results more easily.
Ask Claude:
Plot the resurgence test how it is done in the behavior-analytic literature, in two
stacked panels.

Top panel: average responses per minute for R1, R2 and the distractor in the final 30
seconds of phase 1, the final 30 seconds of phase 2, and the first 30 seconds of phase
3. One point per response per phase with standard error bars, no lines joining the
phases, and the phases labelled along the horizontal axis. Use a filled circle for the
target R1, an open circle for the alternative R2, and a filled triangle for the
distractor.

Bottom panel: the same three responses in ten-second bins, covering the final 30
seconds of phase 2 and all of phase 3. Plot the group mean per bin with standard error
bars, put a vertical line at the phase change, and do not draw a data path across it.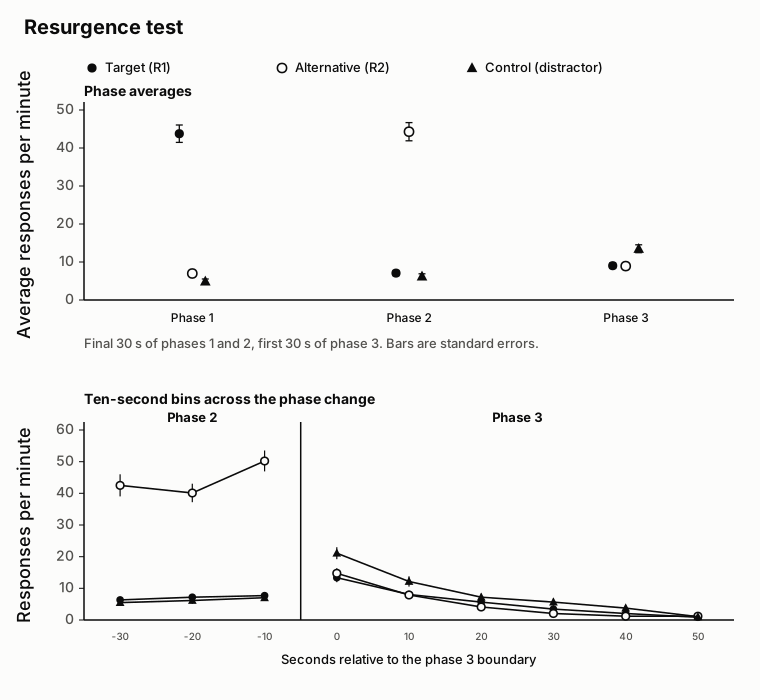
Reading the top panel: Response rates are high on the option that contacted reinforcement
in each phase. Rate of R1 responding was 43.8 responses per minute at the end of phase 1,
and rate of responding to R2 was 44.3 responses per minte at the end of phase 2. In
the first 30 seconds of phase 3, average R1 response rate was 9.0, average R2 response
rate was 8.9, and the distractor was 13.5.
Every participant, not a selection
Ten-second bins for one group average can hide a subgroup behaving differently. Producing a panel for every participant is no more work than producing one, so ask for all of them.
Ask Claude:
Draw the bottom panel again as small multiples: one panel per participant, laid out in
a 7 by 5 grid, using the same ten-second bins and the same three responses. Put every
panel on a common vertical scale so they can be compared, mark the phase change in
each, and label each panel with a participant number.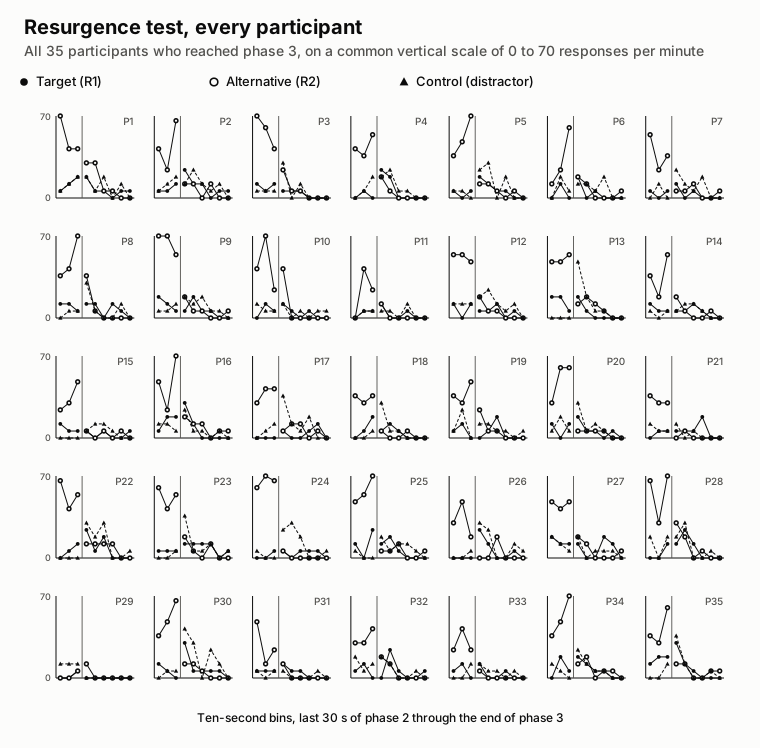
Every participant shows a similar pattern. Alternative responding was high while it led to points. And, all responses reduced toward zero across phase 3. The panels also show how much participants differ in level, which the group means do not. A few participants respond at half the rate of the rest throughout, and the phase 3 group mean of 19.3 responses per minute sits close to the middle of the individual panels rather than describing any one of them.
The pattern of responding with the distractor option influences what we can claim about
behavioral processes controlling responding. On average, it increased from 6.2 to 13.5
responses per minute, which is a larger increase than R1 showed, and it was never
reinforced in any phase. What these data show is that clicking redistributed across the other
two buttons when R2 stopped contacting points. Resurgence was observed for the target
response by definition. But, general behavioral-induced variability was also observed.
Key points
- Compare rates, not raw counts, whenever the periods you compare differ in length.
- Report the group result and the individual result; different audiences will be interested in different analyses.
- The central result here is that responding followed reinforcement across phases, with extinction in phase 3.
- A rise in the previously reinforced response is not resurgence on its own. Compare it
against a response that was never reinforced. Here
R1rose at the start of phase 3, but so did the distractor. You have to interpret what that means behaviorally.
Exercise
Recompute the group mean rate table yourself from the cleaned data. Then pick a participant the earlier lesson flagged as a non-completer and describe what their table looks like and why, in one or two sentences. Confirm your group table a second way by checking that, for one cell, the rate multiplied by the phase length returns the original click count.
Checklist
Use this when running a primary analysis that compares conditions or periods. Read it yourself, and paste it into Claude to have it carry out or check the analysis.
- The data-quality decisions (exclusions, type conversions) are applied and stated before analysis begins.
- Counts are converted to rates whenever the compared periods differ in length.
- The result is reported at both the group level and the individual level.
- Each summary number is confirmed a second way (for example, rate times duration returns the count).
- The mean is compared with the median to check that no small group of participants are influencing it.
- The claims are limited to what the design and the data actually support, and the limits are stated.
To use this with Claude, paste the checklist and add:
Run the primary analysis on the cleaned data from data/synthetic/: response rate in clicks
per minute for each button within each phase, using phase lengths of 2, 2, and 1 minutes.
Report the result at the group level and for one example participant. For each summary
number, confirm it a second way and show the check. State any claim the data cannot support.
Do not change the underlying data; if a cleaning step is needed, describe it and wait for my
confirmation.