Assumptions and choosing an analytic approach
Concept
Between cleaning the data and running the analyses there is a step that produces no output. Because this step produces no numbers, it is easy to treat as though it didn't happen. Analyses can't run without answering these questions. And, if you don't explicitly answer them, then the AI system will do it for you and without your awareness. The result would be results that answer a slightly different question than the one you want to ask, and nothing in the output indicates which question it answered.
There are four such decisions in on our dataset. In each case we compute the result two ways, so you can better see what is at stake. For some of these decisions the difference is negligible, and for others it is substantial, and which is which is difficult to predict in advance.
A note on the data
The figures below use the simulated cohort in data/synthetic/, cleaned as in lesson 14:
38 participants and 9,119 responses. The three real pilot participants remain in
data/pilot/.
Decision 1 — What counts as one observation
The assumption: you know whether your unit is the participant or the response.
This dataset offers two, and they are not interchangeable. A row of responses.csv is one
click. A participant is a person who produced several hundred of them. Nearly every summary
you write can be computed at either level.
Ask Claude:
For the cleaned data, compute the percentage of clicks that were reinforced, once pooling
all rows together and once as the mean of each participant's own percentage. Report both.
What comes back:
pooled across all 9,119 rows:          72.9%
mean of 38 participant percentages:    71.7%
Reading the output: the first treats every click as an observation, so a participant who clicked 500 times counts five times as much as one who clicked 100. The second treats every participant as an observation, giving each person equal weight. The gap of 1.2 points is small here only because no one remaining in the sample clicks wildly more than anyone else. The automated responder, whom lesson 14 removed, would have pushed these two numbers far apart on their own.
Confirm it by asking which question you meant. If the claim is about people, the unit is people. Most claims in behavioral research are about people, which makes the per-participant version the usual default and the pooled version the one requiring justification. Though note that AI system's won't necessarily make the same assumption.
Decision 2 — Whether an absent value is a zero
The assumption: you know what it means when a participant has no rows in a cell.
If a participant never clicked the distractor during phase 2, the data contains no row for that combination. There are two entirely different reasons this can happen. One is that the participant was present and chose not to click. The second is that the participant was not present or the button never showed up for them. The first is a measurement of zero. The second is missing data. Treating them alike is a mistake.
Ask Claude:
Compute the group mean response rate per phase and button three ways: (a) averaging only
over participants who have rows in that cell, (b) filling every missing combination with
zero, and (c) filling with zero only within phases the participant actually reached.
Report the number of participants contributing to each cell.
What comes back:
phase 1          (a) observed   (b) all zeros   (c) zero if reached
R1                     43.6           43.6             43.6
R2                      6.6            6.6              6.6
distractor              5.3            5.3              5.3
n contributing           38             38               38

phase 2          (a) observed   (b) all zeros   (c) zero if reached
R1                      6.4            6.4              6.4
R2                     43.9           43.9             43.9
distractor              5.4            5.4              5.4
n contributing           38             38               38

phase 3          (a) observed   (b) all zeros   (c) zero if reached
R1                      5.7            5.1              5.6
R2                      5.2            4.8              5.2
distractor              8.7            7.8              8.5
n contributing           34             38               35
Reading the output: phases 1 and 2 are identical under all three conventions, because every remaining participant clicked every circle at least once during them. The conventions differ only in phase 3, which is where our primary research question lies. Three participants never reached phase 3, so option (b) records them as having clicked zero times per minute during a phase they never saw, which is not an observation of anything. Option (a) is defensible but drops a participant who reached phase 3 and did not touch one of the circles. Option (c) is the one that matches the two distinct reasons for absence.
The differences in the rates themselves are a few tenths of a click per minute. The change in n is larger and likely is more imporant. The same cell is computed from 34, 38, or 35 participants depending on a choice that appears nowhere in the output if you didn't ask for it.
Decision 3 — Whether the summary describes the data
The assumption: the mean is a fair description of the group.
A mean is a single number standing in for 38. Whether that is an accurate description of central tendencey depends on the shape of the distribution.
Ask Claude:
For phase 1 R1 response rate, report the mean, median, standard deviation, skewness, and
range across participants, and test whether the distribution is normal.
What comes back:
n = 38    mean 43.6    median 45.5    SD 13.3    skew -0.94    range 1.0 to 66.5
Shapiro-Wilk W = 0.947, p = 0.072
Reading the output: the normality test does not reject, since its p-value of 0.072 sits above the conventional 0.05 threshold. Taken at face value, that result would justify using parametric descriptions and statistics. The range is less reassuring. One participant clicked at 1.0 per minute and another at 15.5, against a typical value in the mid-forties, and it is those two who produce the negative skew. And, one participant made 23 clicks in the entire session.
So, the statistical tests passed, but passing it doesn't settle everything. Two participants are shifting the mean below the median, and whether they belong in the analysis is a judgment about engagement, which a normality test cannot make. A statistical test of an assumption is evidence about the assumption rather than a decision about it.
Let's look at the distribution rather than at the summary of it.
Ask Claude:
Plot every participant's phase 1 R1 response rate as one dot per participant, so I
can see the individual people rather than a summary of them. Mark the mean and the
median on the plot, and label the lowest two values.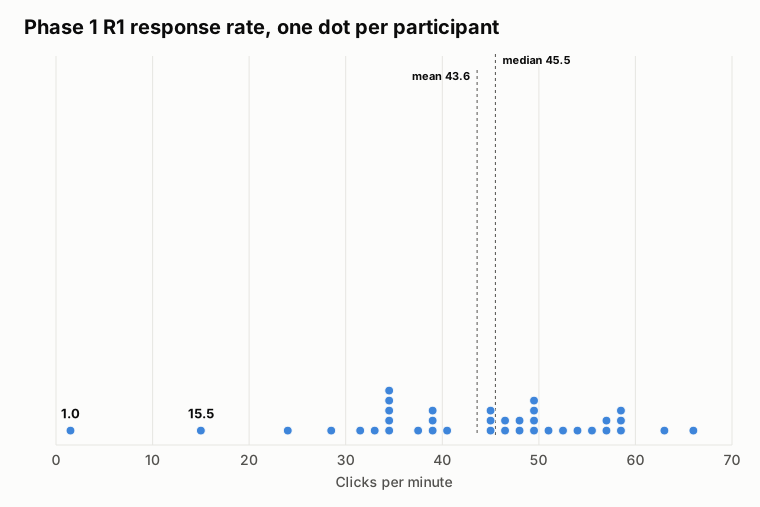
The two low-responding participants are more readily visible now. Asking for one dot per participant rather than a histogram matters here as bins would have absorbed those two into a leftmost bar. But, it is their separateness, not their count, that decides whether they belong in the analysis. Notice also how little space separates the mean from the median on the plot.
Decision 4 — Which tradition you are answering to
The assumption: there is one correct analysis for a given dataset. In practice there is one that suits the question and the audience, and several others that are defensible.
Consider an important comparison of the contingencies in effect. If points were functioning
as reinforcers, R1 clicks in phase 1 should be higher that R1 clicks in phase 2.
Several approaches to this comparison are available. They reach the same conclusion but by
different routes and support different kinds of statements.
Some people arriving at this point may not know which test belongs here. A typical first prompt in that situation might be:
Ask Claude:
Did R1 response rate differ between phase 1 and phase 2? Run the appropriate
statistical test.
What comes back:
independent-samples t-test    t = 16.80   p = 5.8e-27
mean phase 1  43.6      mean phase 2  6.4
This is the wrong test, delivered without hesitation. An independent-samples test treats the phase 1 numbers and the phase 2 numbers as though they came from two separate groups of people. But, they came from the same people, measured twice. Nothing in that output announces the assumption, and the word "appropriate" in our prompt didn't guarantee the correct statistical test was used because we never said what the design was. Asking for the appropriate test does not help when the information needed to identify it was never supplied.
The fix is not to go and learn the names of all statistical tests and to micro-manage the AI system. Rather, the fix is to describe your study and make the choosing happen out loud where you can see it. And, if you don't understand why one test should be chosen over another, ask.
Ask Claude:
I want to compare R1 response rate in phase 1 against phase 2. About the experimental
design: the same people were measured in both phases, so each person has a phase 1
value and a 2 value that belong together as a pair. Before running anything, tell me which
test fits that design, what it assumes about the data, and whether those assumptions
hold here. If more than one test is defensible, run each of them and show me whether
they agree. Also tell me how many individual participants show the effect.
Everything in that prompt is something you likely already would want to ask without knowing any statistics. The important information is "the same people were measured in both phases" and communicating any other information about the experimental design and how the data were collected.
What comes back:
Which test fits: your design is one group measured twice, so each person's phase 1
and phase 2 values are a pair. That calls for a paired test, not an
independent-samples test.

What it assumes: that the differences between each person's two values are roughly
normally distributed, that participants are independent of one another, and that the
rates are on a scale where a difference is meaningful.

Whether normality assumption holds: Shapiro-Wilk on the 38 differences gives W = 0.960, p = 0.19,
so normality is not rejected. The differences are mildly left-skewed (-0.68). The
Wilcoxon signed-rank test does not require normal differences, so I ran it as a
check. I also ran the independent-samples test, which does not fit this design, so
you can see what it would have reported.

mean phase 1  43.6      mean phase 2  6.4      mean difference  37.2

paired t-test            t = 18.81   p = 1.6e-20
independent t-test       t = 16.80   p = 5.8e-27
Wilcoxon signed-rank      W = 0.0    p = 7.7e-08
participants showing the effect individually:  38 of 38
The first three paragraphs are the part worth reading twice. They are the series of steps that the earlier prompt performed without an output and got wrong. Now they are stated directly where you can check the assumptions before you evaluate the results. Note that it identifies the design, gives the assumptions in terms of what the data would have to look like, and then tests those assumptions.
Reading the output: a test of this kind asks how likely a difference this large would be if there were no real difference; a very small p-value means such a result would be unlikely by chance alone if there was no difference between the conditions. All four rows indicate that the effect is present, but they are not equally appropriate to this design.
Notice what the independent-samples row does now that we can see it beside the others. It is the wrong test for this design, and it produces the smallest p-value of the three, by 6.4 orders of magnitude. The incorrect analysis returns the most impressive-looking result. That is the reason not to choose a test by how the output reads, and the reason the first prompt was misleading and unhelpful.
The Wilcoxon test makes fewer assumptions about the shape of the distribution and gives a larger p-value than the paired test. It is the more conservative choice and is defensible here given the two low participants from the third decision above.
The last line is the one you will likely care about most. All 38 participants,
individually, clicked R1 more in phase 1 than in phase 2, with no exceptions. That
statement requires no test at all, and for a within-subject demonstration it is better
evidence than any of the three p-values, because it shows the effect occurred at the
individual level.
Asking for a test you can't name
The prompt above can be generalized. Whatever the comparison, supply the things that you know, and ask for the rest:
- Say who was measured and how often: One group measured twice, two groups measured once, the same people measured at five time points. This is one of the primary facts that determines the right statistical test. And, it may not exist in your data file.
- Ask for the choice before the result: "Tell me which test fits and what it assumes, and check whether those assumptions hold here, before you run anything." A test named after the fact can be a test chosen to fit the answer.
- Ask what else was defensible: If two or three approaches are reasonable, run them all. Agreement is reassuring. Disagreement is a finding because it suggests something about the assumptions made when analyzing data influences the claim of an effect. People want to know that.
A fourth question always worth asking is "what did you assume about my design?" Asking this questions increases the likelihood you'll catch a wrong assumption and the analytics can then be modified accordingly.
Key points
- Data analytics involve many decisions that have ot get made whether or not you make them, and they don't show up in AI system outputs.
- Fix the unit of analysis first. Most behavioral claims are about people, so the participant is usually the observation.
- Distinguish a measured zero from missing data. Many analyses require filling in missing data for the code to work. You should know how that's being done and be able to justify that choice.
- A test of an assumption is evidence about the assumption, not a decision about it. Normality passed here while two participants were visibly distorting the mean.
- The wrong statistical test can produce the more impressive result. Select the test from the design, not from its output.
- You do not need to know which test to ask for. Describe what was measured and how often, ask for the choice and its assumptions before the result, and ask what else was defensible. You can always ask the AI system to prove why the test is right rather than to take their word for it.
- Where the design allows, report both the group test and the individual-level statement. This will increase your ability to talk broadly to scientists and practitioners of varied educational backgrounds.
Exercise
Take one cell of the phase-by-button table and compute it under all three absence
conventions from decision 2, reporting the n for each. Then, for the phase 2 comparison of
R2 against R1, decide before running anything which test the design calls for and write down your
reason. Run the paired and independent tests, and check whether your prior reasoning matches
which one you would now report.
Checklist
Use this after data cleaning and before data analysis. Read it yourself, and paste it into your AI system to have it state its assumptions before it computes anything.
- The unit of analysis is stated: participant or observation, and whether it changes for different analyses.
- Where pooled and per-participant versions differ, both are known and the choice is justified.
- Missing values are classified as measured zeros or as missing, and treated accordingly.
- The number of participants contributing to each cell is reported, not just the mean.
- The distribution is inspected visuall, not only summarized; mean and median are compared.
- Any participant visibly influencing a summary is identified and an inclusion decision made on stated criteria.
- The statistical approach follows from the design (repeated measures implies a paired analysis).
- The individual-level result is reported alongside the group result where the design allows.
- The conclusion is checked for stability across defensible alternative approaches.
To use this with Claude, paste the checklist and add:
Before running any analysis on the cleaned data from data/synthetic/, state every analytic
decision you are about to make and the alternatives you are rejecting such as the unit of analysis,
how you will treat absent values, which summary statistics you will report, and which
statistical approach the design calls for. For each decision, tell me what the result would
be under the alternative. Wait for me to confirm the choices before computing anything.