Validating analytic outputs
Concept
Lesson 14 asked whether the data could be trusted. This lesson asks whether the results we've obtained can be trusted. Those are separate problems. Clean data used with the wrong calculations produces wrong answers, but the output will be presented without any indication of its validity.
The difficulty is that an analytic result arrives with no indication of its own validity. A number that is off by a factor of two is presented exactly like a number that is correct. There is no error message because nothing failed. A completed calculation produces an output whether or not the statistical test was the right one. You establish the validity of a result through additional work after the number appears.
This lesson provides four checks to test the validity of results obtained from an AI system. Each one catches a class of error the others do not. You may notice these from previous lessons. Here, we're just making them explicit and providing a few more exammples.
The four checks:
- Recompute the number by a different route.
- Verify the operations preserved what they should have preserved.
- Test whether the result survives a decision you could reasonably have made differently.
- Confirm the number was actually computed rather than described by the AI system from "its memory".
A note on the data
Everything below is computed against the simulated cohort in data/synthetic/, cleaned
according to the decisions made in lesson 14: orphan rows removed, the automated responder
excluded, reinforced converted to true/false. That leaves 9,119 responses from 38
participants. The three real pilot participants remain in data/pilot/.
Check 1 — Recompute by a different route
The assumption: the number reported is the number the data supports.
This is the simplest of the four checks. Compute the same quantity a second time by a path that shares as little as possible with the first. If the two agree, the number is more likely to be valid. If they disagree, that disagreement needs to be investigated.
Ask Claude:
For the cleaned data, report the percentage of clicks that were reinforced. Compute it two
ways: first pooled across all rows, and second as the mean of each participant's individual
percentage. Report both and explain any difference.
What comes back:
pooled across all rows:            72.9%
mean of per-participant percentages: 71.7%
Reading the output: These are not the same number, and neither is technically inaccurate. The first pools every click in the dataset and asks what fraction earned a point, so a participant who clicked 500 times influences it more than one who clicked 100 times. The second gives every participant equal weight regardless of how much they clicked. The 1.2 point gap is the influence of the participants with higher response rates.
Neither figure is the correct one. "Percentage of clicks reinforced" is an underspecified request. The ambiguity is resolved somewhere in the computation, and the output does not record which definition was used. If you did not choose between these two definitions, one was chosen for you.
Confirm it a second way at the smallest scale you can. Check the pipeline against arithmetic you can do yourself.
Ask Claude:
Take one participant and one cell of that table, and show me the calculations in full.
Specifically, show me how many clicks they made on that button in that phase, how long the
phase was, and what rate that gives. Keep it small enough that I can check it by hand
against their raw rows, and tell me what the group pipeline reports for the same cell.
What comes back:
# participant c0xiwarmi7, phase 1, button R1
count = 89                 # counted directly from their rows
rate  = count / 2          # phase 1 is two minutes -> 44.5 clicks per minute
The group pipeline reports 44.5 clicks per minute for this participant in this cell. Because the hand count and the pipeline agree on a case you worked yourself, the pipeline is doing what you believe it is doing. Checking one case by hand tells you more than reading the code and judging it plausible.
Check 2 — Verify the operations preserved what they should
The assumption: combining tables adds columns, not rows.
People skip this check most often, and it produces large errors without warning. Joining two tables is supposed to attach each participant's demographics to their responses. It should leave the number of responses unchanged.
Ask Claude:
Merge the cleaned responses with demographics.csv on participantId. Report the row count
before and after the merge, and explain any change.
What comes back:
rows before merge:  9,119
rows after merge:   9,362      (+243)
Reading the output: the merge added 243 rows to a table that should not have grown at all. The cause traces back to a problem lesson 14 already found. One participant submitted the demographics form twice, so there are two demographics rows with their identifier. Every one of that participant's 243 clicks matched both rows and was therefore duplicated.
The general problem matters more than this instance. The duplicate demographics record was already known and already documented, and it still propagated into a later analysis, because the fix was never applied before the join. Finding a data problem and fixing it are separate steps. Only the fix changes your results.
The consequence shows up in anything computed from the merged table:
mean age computed from the merged rows:        34.29
mean age computed per participant (n = 36):    34.72
The first number weights each participant by how many times they clicked, and counts the duplicated participant twice on top of that. It is an average of ages weighted by clicking activity, not the mean age of the sample.
Confirm it by stating the condition that has to hold.
Ask Claude:
Fix the merge issue. Drop the duplicate demographics record first so each
participant has exactly one row, then join. After the join, add a check that stops the
analysis with an error if the number of response rows changed, instead of letting it
carry on. Show me the row count before and after.
What comes back:
before = len(clean)
merged = clean.merge(demo.drop_duplicates("participantId"), on="participantId", how="left")
assert len(merged) == before      # a left join must not change the row count

print(len(demo), len(demo.drop_duplicates("participantId")))   # 40 39
print(before, len(merged))                                     # 9119 9119
The duplicate record is what the first line removes: 40 demographics rows become 39, one per participant. The row count is then 9,119 before the join and 9,119 after it, so the assertion passes and the analysis continues.
The lesson: After every merge, check the row count. After every filter, check how many rows were removed and whether that matches what you intended. Compute a per-participant quantity from a per-participant table, never from a per-click table.
Check 3 — Test whether the result survives a different decision
The assumption: the conclusion reflects the data, not the analyst's choices.
Every exclusion rule in lesson 14 was a judgment. Reasonable people would have made some of them differently. A valid result should not depend on which reasonable choice you made. The only way to know is to compute it under each.
Ask Claude:
Compute the group mean response rate for R1 in phase 1 and R2 in phase 2 under four
inclusion rules: (a) everything in the file, (b) orphan rows dropped, (c) orphans and the
automated responder dropped, (d) also dropping the non-completers. Plot the four rules on
a common horizontal axis of responses per minute, one row per rule, with a filled marker
for the phase 1 R1 rate and an open marker for the phase 2 R2 rate. Label each row with
the number of participants contributing to it, and give me the numbers as well.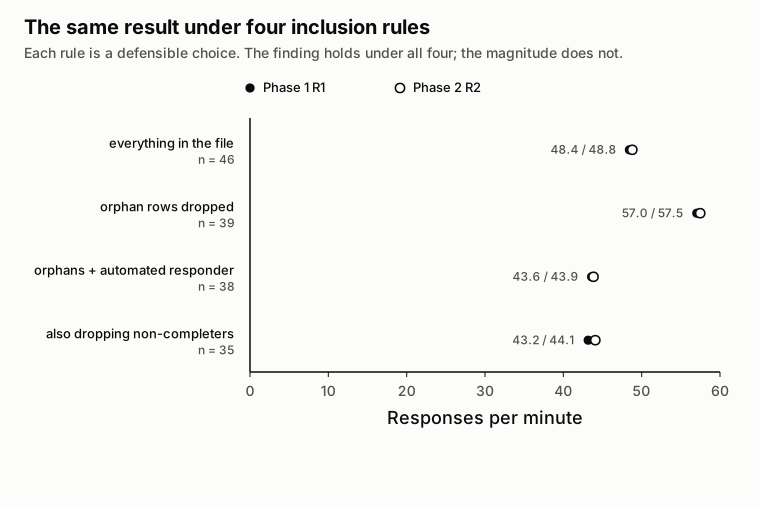
Looking at the plot: The finding is stable. Under every rule, the circle that provided points was
clicked roughly seven to nine times as often as the circles that did not, and the pattern
shifts from R1 to R2 between phases. The finding is present under all four rules, which
is suggests the finding does not depend on the decisions of the data analyst.
Check 4 — Confirm the number was computed, not described
The assumption: every number in the response came from the data.
An AI system produces fluent text alongside code and data outputs. All of that gets mixed together as context to influence the next response it makes. Over time, this can lead to prose and context that contains figures that were never calculated. A percentage might sound right, a sample size carried over from earlier in the conversation, a statistic described rather than run.
This check is procedural and quick. Ask for the code alongside every number, and to re-run it.
Ask Claude:
For every number in your previous response, show the exact code that produced it. If a
number was not produced by code you ran, say so explicitly.
What to look for in the answer: whether a line of code exists for each figure, and whether
the filters in that code say what you think they say. Read the filter conditions
specifically. A calculation restricted to phase == 1 when you meant all phases, or to
completers when you meant everyone, produces a number that is correct for a question you did
not ask. This kind of error survives every check except reading the code. And, if you don't
know how to read the code, no worries. Just ask the AI system to explain how the code in front
of you led to the analytic outputs you see.
Key points
- Validating data and validating results are separate tasks. Clean data and a wrong calculation produce a wrong answer that looks identical in presentation to a right answer.
- Recompute every reported number by a second route. Disagreement between routes is more informative than either number.
- Check that operations preserved what they should. A merge must not change the row count, a filter must remove the number of rows you expected.
- Knowing about a data problem is not the same as having fixed it. The duplicate demographics record was documented in lesson 14 and still produced an incorrect merge here.
- Report a result only if it survives the reasonable alternative decisions you could have made, and say in the writeup that it does.
- Any number that does not come with code that runs is unverified. Ask for the code and re-run it.
Exercise
Return to the list you wrote in lesson 12 of three claims from the one-shot analysis that you could not verify at the time. Take each one and either verify it or show that it is wrong, using the checks from this lesson. Then take one number from your own analysis in lesson 16 and compute it by a genuinely different route, not a rearrangement of the same calculation. Write one sentence stating whether the two routes agreed and what you concluded.
Checklist
Use this on any analytic result before it becomes a claim. Read it yourself, and paste it to Claude to have it validate its own output.
Recompute
- Every reported number is computed a second time by a different route, and the two agree.
- At least one result is checked by hand against a single participant or a small subset.
- Where a quantity is ambiguous (pooled versus per-participant), the definition used is stated and applied consistently.
Preserve
- Row counts are checked before and after every merge; a join that adds rows is investigated, not accepted.
- Every filter reports how many rows it removed, and the number matches the intent.
- Per-participant quantities are computed from a per-participant table, not from per-click rows.
- Data problems found earlier have actually been applied as fixes, not just documented.
Survive
- The result is recomputed under each reasonable alternative inclusion rule.
- The direction of the finding is stable across those rules, and the spread in magnitude is known.
- Means are compared with medians, and distributions are inspected rather than only summarized.
Trace
- Every number is accompanied by the code that produced it, and that code has been re-run.
- The filter conditions in that code have been read and match the question actually being asked.
- Any number that cannot be traced to code is removed or marked unverified.
To use this with Claude, paste the checklist and add:
Validate the analysis you just produced against each item on this checklist. For every
number you reported, show the code that produced it, recompute it by a different route, and
report whether the two agree. Check row counts before and after any merge or filter. Recompute
the main result under each reasonable inclusion rule and report the spread. Where a check
fails, or where a quantity was ambiguous and you resolved it without asking, say so
explicitly rather than correcting it without telling me.